Skills
Standard Deviation in A Level Geography
Standard deviation is a statistical measure that shows how spread out a set of data values is from the mean (average). In A Level Geography, it’s used to describe and compare variation in physical and human datasets, such as rainfall totals, river discharge, temperatures, sediment size, deprivation scores or migration rates.
A small standard deviation means values are closely clustered around the mean (low variability). A large standard deviation means values are widely spread (high variability).
Where will I use standard deviation in A Level Geography?
Standard deviation is useful whenever you want to compare how consistent or variable data is, for example:
- Water & Carbon Cycles: variability in rainfall, discharge, interception or soil moisture
- Coastal Systems: variability in sediment size (sorting) or beach profile measurements
- Hazards: variability in hazard frequency/magnitude (e.g. annual earthquakes, storm days)
- Global Systems & Governance / Changing Places: variability in income, deprivation, access to services, health or education
- NEA: comparing two locations, two time periods, or testing whether one site is “more variable” than another
The standard deviation formula
For AQA A Level Geography, students should be able to use the population standard deviation formula:
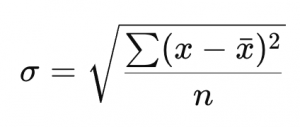
Key:
σ = population standard deviation
Σ = “sum of”
x = each value
x̄ = mean
n = number of values
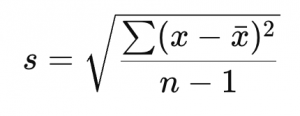
Sample standard deviation (useful for NEA)
If your data is a sample (common in fieldwork), you may also see:
Step-by-step method for calculating standard deviation
- Calculate the mean (x̄)
Add all values and divide by the number of values (n). - Find each deviation from the mean
Calculate x−x̄ for every value. - Square each deviation
Calculate (x−x̄)² for every value. - Add the squared deviations
Work out ∑(x−x̄)² - Divide by n
This gives the variance. - Square root the variance
This gives the standard deviation.
Worked example
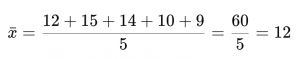
River discharge recorded (cumecs):
12, 15, 14, 10, 9
1) Calculate the mean
2) Calculate deviations and squared deviations
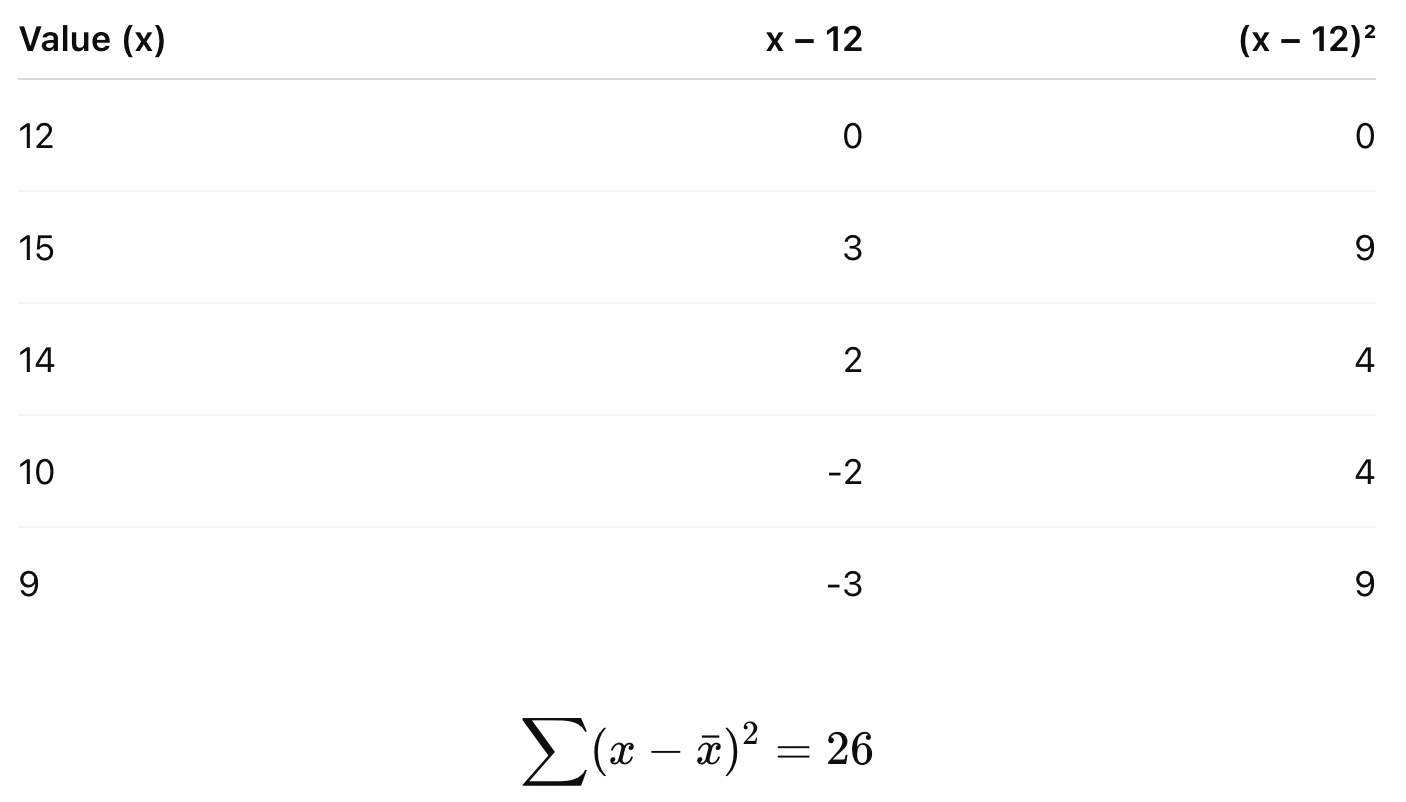
3) Divide by n (variance)
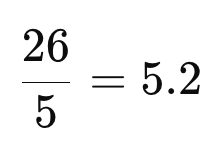
4. Square root
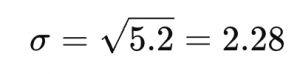
Standard deviation = 2.28 cumecs
Interpretation: River discharge typically varies by about 2.28 cumecs from the mean discharge of 12 cumecs.
How to interpret standard deviation in Geography
When you interpret a standard deviation value, you should always:
- State the mean
- State the standard deviation
- Explain what it suggests about variability
- Compare two datasets if given
- Link to a geographical process
Example interpretation sentence:
“The mean rainfall is 80 mm with a standard deviation of 2 mm, suggesting rainfall is consistent from month to month. This would reduce short-term variability in river discharge and may lower the likelihood of flash flooding.”
Exam Tip
Coming soon